Record a channel via Epiphan Live
You can control the recording of channels and recorders directly from the Epiphan Live Dashboard interface. (See Accessing Epiphan Live for information about logging in to Epiphan Live.)
Streaming (and recording) control buttons are located under the Channels heading.
For each channel, the stream control is the left-most button containing the "signal" icon, and the recording control is the right-most button containing the circle icon.
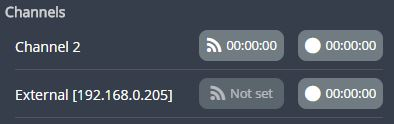
When a channel is not being streamed or recorded, the streaming and recording buttons are gray in color and their respective timers are set to 00:00:00.
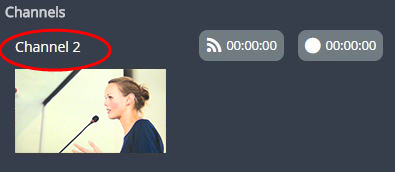
You can preview a channel by clicking on its name to display a small dropdown thumbnail view.
To start recording (and streaming) a channel, simply click the channel's recording (and/or streaming) buttons.
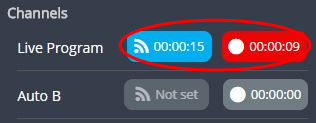
When clicked, the streaming button turns blue in color and the recording button turns red. The timer contained within each respective button also begins to count upward.
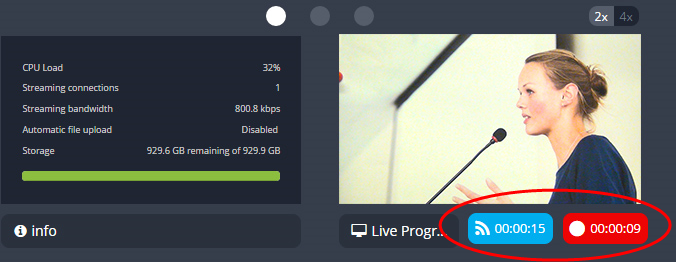
Alternatively, you can also control streaming and recording of a channel via the Dashboard's monitoring panels. See Networked VGA Grid User Guide You are here: Start here > Epiphan Live > Streaming, recording and monitoring using the Dashboard interface > Configuring Dashboard panels for visual confidence monitoringStreaming, recording and monitoring using the Dashboard interfaceUnderstanding the Dashboard interfaceConfiguring Dashboard panels for visual confidence monitoringMonitoring video and audio sourcesControlling streaming and recording using Epiphan LiveConfiguring Dashboard panels for visual confidence monitoringYou can customize each Dashboard panel to display a specific channel, or source. Epiphan Live allows you to configure up to 8 different panels for comprehensive live preview confidence monitoring of channels and sources. Note that when Dashboard panels are configured, other users idle on the Dashboard interface must refresh the page in their web browser to display the updated panels.The limit of 8 live preview panels applies across all other open instances of Epiphan Live (additional users may access Epiphan Live simultaneously from separate locations, for example, or an operator may accidentally open a duplicate Epiphan Live interface.)You can also display the following set of basic system information in your panels:CPU load (%).Quantity of streaming connections.The current streaming bandwidth (bitrate).Automatic file upload status (enabled or disabled). See File and recording transfer.Storage available on your Networked VGA Grid.To configure your Dashboard panels:Log in to Epiphan Live (see Accessing Epiphan Live).Click the drop down box under your desired panel (text says "None" if the panel is not yet configured), and select a channel, source or output from the dropdown menu. Control streaming and recording directly from the Dashboard panel! When a channel is applied to a Dashboard panel, streaming and recording control buttons appear under the panel.Click Save in the upper-right corner of the page to preserve your changes (if you don't save, then your panel configuration changes are lost when you refresh or navigate away from the Dashboard).You can navigate between 3 separate sets of Dashboard panels by clicking the circle icons above the first row of panels. You can also configure each panel set to display either 2 or 4 panels by clicking the 2x/4x icons above the upper-right Dashboard panel. for more information.