Monitoring video and audio sources
In the Dashboard interface, you can specify video and audio inputs and view the details for each input.
Video sources
By default, the video inputs section of the Dashboard view lists all inputs configured on your Networked VGA Grid.
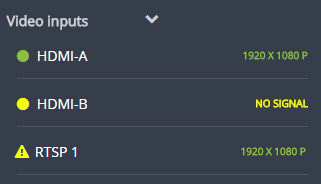
- A green circle icon next to the input name means that the video source is connected to your Networked VGA Grid and a signal is received. Accompanying text to the right of the input name provides the input's resolution.
- A yellow circle icon next to the input name means that your Networked VGA Grid is not receiving a signal from your source.
- A triangular warning icon next to the input name means there is a source configuration issue that requires your attention.
Configure the video input list
You can customize the video inputs displayed on the Dashboard interface by clicking the Video inputs header.
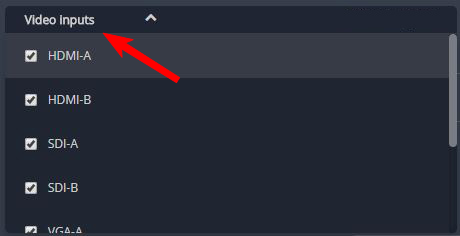
Click the checkbox next to the name of each source to show or hide sources in the Dashboard view (the Dashboard video input list updates automatically). Make sure to save your changes by clicking the Save icon in the upper-right corner of your browser!
View video source details
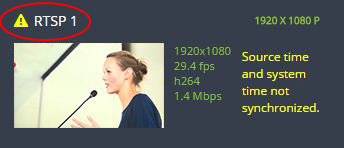
Click the name of a video input to display your source in a small dropdown thumbnail view with warning details (if there is a warning icon next to your source's name) and accompanying source details:
- HDMI, SDI, DVI and VGA sources display resolution and refresh rate.
- RTSP sources (such as IP cameras) display resolution, frame rate, codec used and bitrate.
- VGA Grid HD Encoder sources display resolution only.
Audio sources
By default, the audio inputs section of the Dashboard view lists all inputs configured on your Networked VGA Grid.
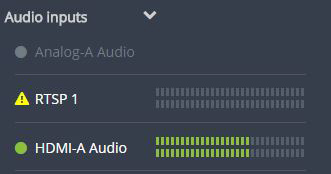
- A grayed-out audio source name means that the audio source is not used in any channels.
- A triangular warning icon next to the input name means there is a source configuration issue that requires your attention. Click the audio source name to display the corresponding warning message.
- A green circle icon next to the audio source name means the source is connected to your Networked VGA Grid. The accompanying VU meter to the right of the input name provides the source's volume level.
Read the VU meter
The on-screen VU meter uses quasi-peak ballistics with samples averaged every 10 ms. The maximum average in each 100 ms period is displayed as a series of colored bars. The following table describes the levels at which the meter changes from green to yellow and red.
Audio VU meter levels
| Color | Decibel range |
|---|---|
| Red | 0 to -9 dBFS |
| Yellow | -9 to -18 dBFS |
| Green | -18 dBFS and lower |
Configure the audio input list
You can customize the audio inputs to display in the Dashboard view by clicking the Audio inputs header.
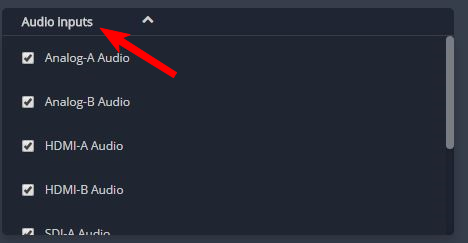
Click the checkbox next to the name of each source to show or hide sources in the Dashboard view (the Dashboard audio input list is updated automatically). Make sure to save your changes by clicking the Save icon in the upper-right corner of your browser!
