Configuring Dashboard panels for visual confidence monitoring
You can customize each Dashboard panel to display a specific channel,
The limit of 8 live preview panels applies across all other open instances of Epiphan Live (additional users may access Epiphan Live simultaneously from separate locations, for example, or an operator may accidentally open a duplicate Epiphan Live interface.)
You can also display the following set of basic system information in your panels:
- CPU load (%).
- Quantity of streaming connections.
- The current streaming bandwidth (bitrate).
- Automatic file upload status (enabled or disabled). See File and recording transfer.
- Storage available on your Networked VGA Grid.
To configure your Dashboard panels:
- Log in to Epiphan Live (see Accessing Epiphan Live).
- Click the drop down box under your desired panel (text says "None" if the panel is not yet configured), and select a channel, source or output from the dropdown menu.
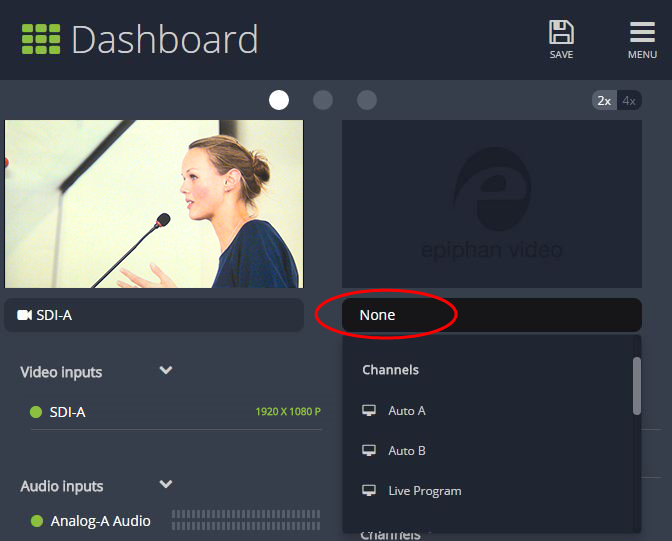
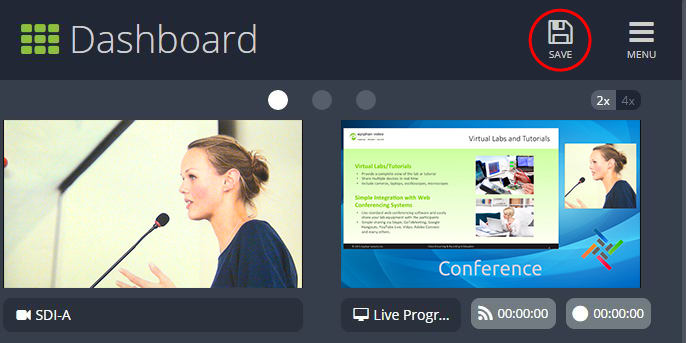
Control streaming and recording directly from the Dashboard panel! When a channel is applied to a Dashboard panel, streaming and recording control buttons appear under the panel.
- Click Save in the upper-right corner of the page to preserve your changes (if you don't save, then your panel configuration changes are lost when you refresh or navigate away from the Dashboard).
You can navigate between 3 separate sets of Dashboard panels by clicking the circle icons above the first row of panels.
You can also configure each panel set to display either 2 or 4 panels by clicking the 2x/4x icons above the upper-right Dashboard panel.
