Preview a source
You can preview the images captured from your sources in the Admin panel.
You can also preview your sources using the Epiphan Live control interface. See Networked VGA Grid User Guide You are here: Start here > Epiphan Live > Streaming, recording and monitoring using the Dashboard interface > Monitoring video and audio sourcesStreaming, recording and monitoring using the Dashboard interfaceUnderstanding the Dashboard interfaceConfiguring Dashboard panels for visual confidence monitoringMonitoring video and audio sourcesControlling streaming and recording using Epiphan LiveMonitoring video and audio sourcesIn the Dashboard interface, you can specify video and audio inputs and view the details for each input.Video sourcesBy default, the video inputs section of the Dashboard view lists all inputs configured on your Networked VGA Grid.A green circle icon next to the input name means that the video source is connected to your Networked VGA Grid and a signal is received. Accompanying text to the right of the input name provides the input's resolution.A yellow circle icon next to the input name means that your Networked VGA Grid is not receiving a signal from your source.A triangular warning icon next to the input name means there is a source configuration issue that requires your attention.Configure the video input listYou can customize the video inputs displayed on the Dashboard interface by clicking the Video inputs header.Click the checkbox next to the name of each source to show or hide sources in the Dashboard view (the Dashboard video input list updates automatically). Make sure to save your changes by clicking the Save icon in the upper-right corner of your browser!View video source detailsClick the name of a video input to display your source in a small dropdown thumbnail view with warning details (if there is a warning icon next to your source's name) and accompanying source details:HDMI, SDI, DVI and VGA sources display resolution and refresh rate.RTSP sources (such as IP cameras) display resolution, frame rate, codec used and bitrate.VGA Grid HD Encoder sources display resolution only.Audio sourcesBy default, the audio inputs section of the Dashboard view lists all inputs configured on your Networked VGA Grid.A grayed-out audio source name means that the audio source is not used in any channels.A triangular warning icon next to the input name means there is a source configuration issue that requires your attention. Click the audio source name to display the corresponding warning message.A green circle icon next to the audio source name means the source is connected to your Networked VGA Grid. The accompanying VU meter to the right of the input name provides the source's volume level.Read the VU meterThe on-screen VU meter uses quasi-peak ballistics with samples averaged every 10 ms. The maximum average in each 100 ms period is displayed as a series of colored bars. The following table describes the levels at which the meter changes from green to yellow and red.Audio VU meter levelsColorDecibel rangeRed0 to -9 dBFSYellow-9 to -18 dBFSGreen-18 dBFS and lowerConfigure the audio input listYou can customize the audio inputs to display in the Dashboard view by clicking the Audio inputs header.Click the checkbox next to the name of each source to show or hide sources in the Dashboard view (the Dashboard audio input list is updated automatically). Make sure to save your changes by clicking the Save icon in the upper-right corner of your browser! for more information.
To preview the captured stream/images in the Admin panel:
- Login to the VGA Grid HD Encoder's Admin panel as admin. See Connect to the Admin panel.
- Ensure a source is connected to the input port, see Connect a source.
- From the Admin panel, click the source name from the Sources menu; the source configuration page opens.
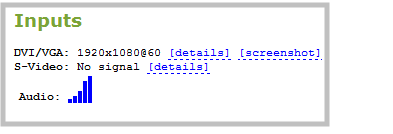
- From the Admin panel, click the Info link; the info page opens.
- Click screenshot to preview the captured stream.