Run diagnostic tests using the device screen
You can access a useful diagnostic tool from the device screen when you select Settings > Network and select Connectivity Status.
Available device screen diagnostic tools for Pearl Mini
- Connectivity status: Display the status of critical network connections and features like 802.1x, see Run diagnostic tests using the device screen.
- Ping: Test if the Pearl device can reach a specified destination server on the network. Not all networks support ping.
- Trace route: Trace the route that packet traffic takes to get from the Pearl device to a specified destination server on the network. Not all networks support traceroute.
- Bandwidth test: Display the available upload and download bandwidth speed in Mbps up to a maximum bandwidth of 1000 Mbps.
- Domain name resolution: Confirm that the Pearl Mini can resolve a Fully Qualified Domain Name (FQDN) using the DNS server that is configured for the Pearl Mini.
- Probe: Check if Pearl device can establish communication to a specific port on a network host using a network protocol that you specify. Supported network protocols are: TCP, HTTP, HTTPS, RTSP, RTMP, and RTMPS.
To troubleshoot networking issues yourself, try to ping the IP address of your Pearl Mini or do a traceroute to a server such as 8.8.8.8. If you are unable to resolve your networking issues, contact your network administrator and provide them the IP address and MAC address of your Pearl Mini or contact Epiphan support.
For more information about diagnostic tools and test results, see Diagnostic tools.
Run diagnostics from the touch screen
-
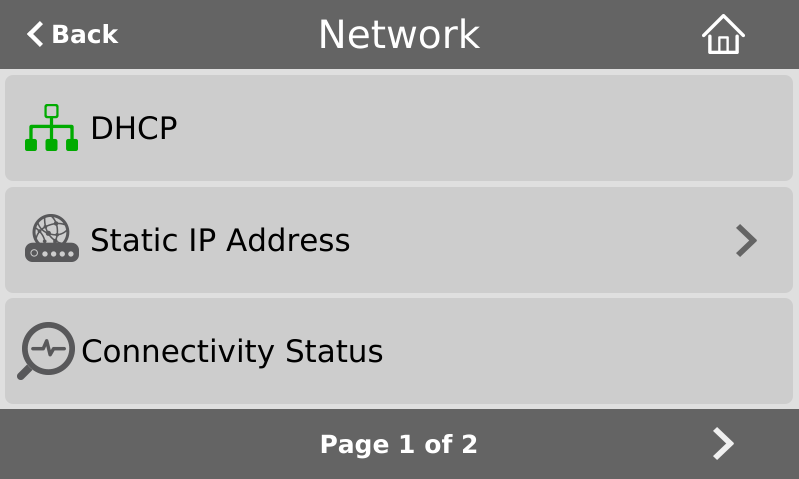
- Select Network. The Network settings page opens.
- To run the connectivity status diagnostics, select Connectivity status and then select Start on the Connectivity status screen.
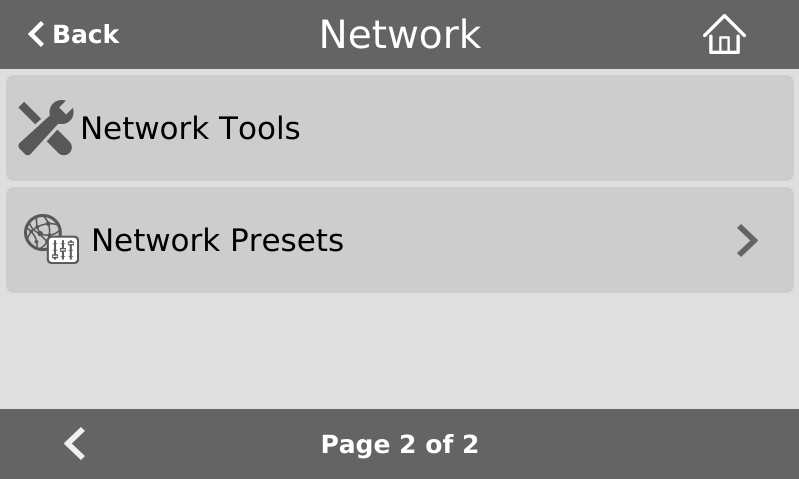
Use Network Tools on Pearl Mini
- To run other diagnostic tools, tap the chevron icon in the bottom right of the screen to go to the second page of network options, and then tap Network Tools.
- Do one of the following:
- If Ping is selected, enter the destination server IP address or domain name in the empty field.
- If Trace route is selected, enter the destination server IP address or domain name to routetrace in the empty field.
- If Bandwidth test is selected, the measured upload and download bandwidth displays after you click Start.
- If Domain name resolution is selected, enter the IP address or server name to resolve in the empty field.
- If Probe is selected, choose the transport protocol from the drop-down menu and then enter the destination server IP address or server name along with the port in the empty field. For example, enter: 10.100.10.1:1234 or domain.example.com:1234
- Tap Start.